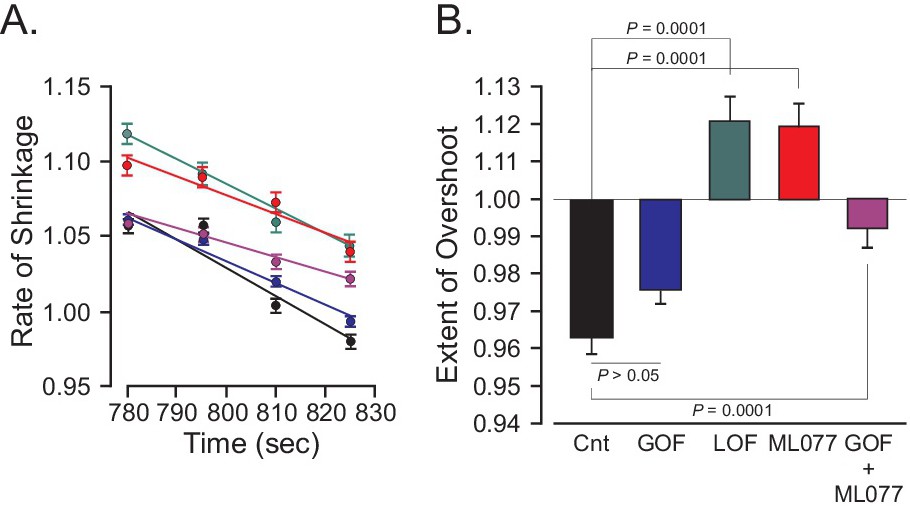
Fig. 6. Osmotic behavior of neurons broken-down by components. A, rate of shrinkage of neurons when they are returned to isosmotic saline following a 10 min exposure to hypotonicity. Note that the slopes are not very different amongst genotypes. B, Extend of cell shrinkage. The Y axis represents relative fluorescence where 1 represents the original fluorescence of the cells under isosmotic solution prior to the osmotic shock. A negative bar (as for control neurons and KCC3 T991A neurons) represents a volume overshoot, whereas a positive bar (as KCC3 knockout neurons and wild-type neurons treated with 10 µM ML077) represents a volume still larger than the original volume of the neurons. Bars represent means ± SEM (3 mice, 98-229 neurons). Significance was calculated using one-way ANOVA followed by Tukey Post-hoc analysis test.